Monitoring Metrics with Orbit
Overview
Orbit provides a convenient dashboard for data scientists, machine learning engineers, and business users to monitor model performance. This allows for quick identification of performance related issues across a variety of metrics that may be associated with various models for a project.
Tracking Metrics
Orbit enables users to track production metrics using the SDK feature track_production_metrics() as seen below in evaluate.py
import foundations
from datetime import datetime

metric_name = 'my_metric'
inference_date = str(datetime.strftime(datetime.now(), "%Y-%m-%d %H:%M:%S"))

calculated_metric_value = 0.7 #sample value
metric_values_dictionary = {inference_date: calculated_metric_value}

foundations.track_production_metrics(metric_name, metric_values_dictionary)
where metric_values_dictionary is a dictionary with key-value pairs of the interference date formatted as "%Y-%m-%d %H:%M:%S" and the calculated metric value.
In the example above, a hard-coded value is used for the calculated metric. In an actual use-case, the user would write code to load in model prediction data from a datastore.
Creating a monitor for tracking metrics
Similar to validating data with Data Contracts, the metric evaluation python script can also be scheduled using either Orbit's built-in scheduler or via a third-party workflow management system (e.g. Airflow, Luigi). If using the built-in Orbit Scheduler, a Monitor for tracking metrics can be created using the follow command as previously shown:
foundations monitor create --name evaluator --project_name example-project . evaluate.py
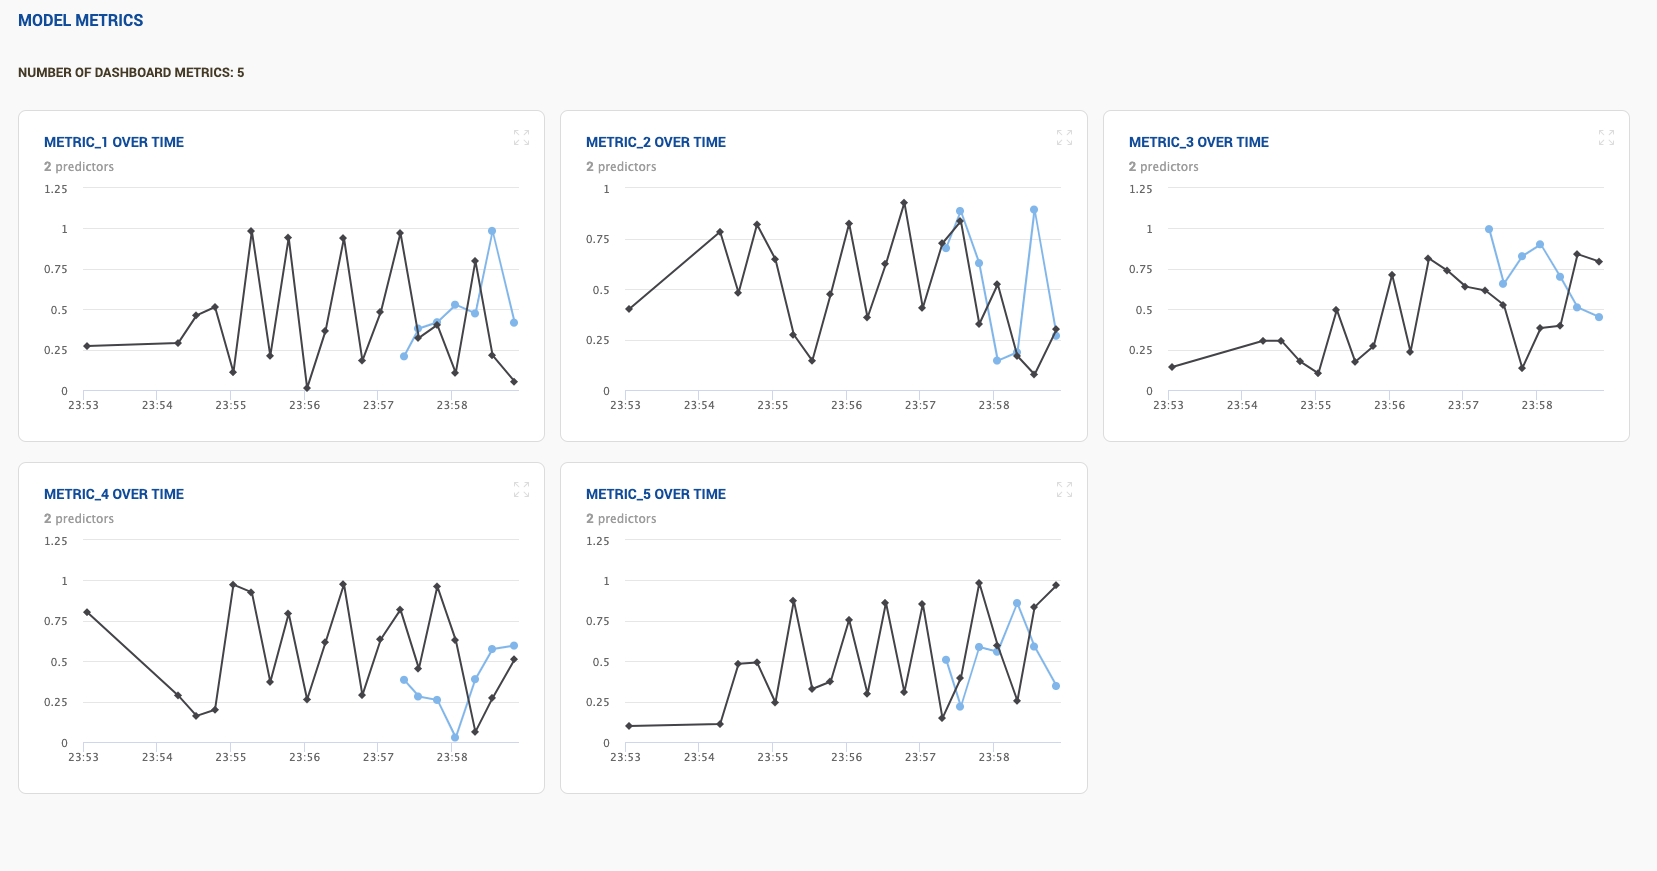
The Monitor can then be scheduled by navigating to the Orbit GUI and specifying the schedule. Once the Monitor has
executed its first job, the results will be available in the Model Evaluation tab ( ![]() ) on the left-hand side of the screen.
) on the left-hand side of the screen.
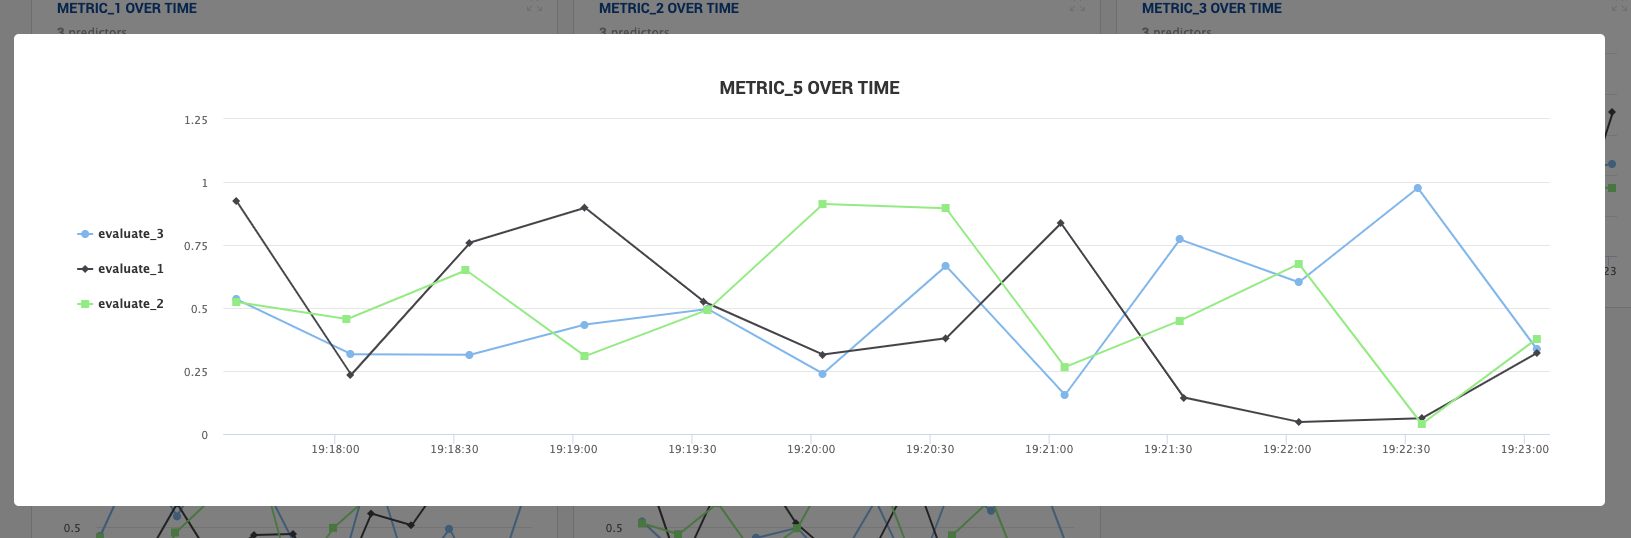
Plotting multiple trends for the same metric
Orbit enables you to visualize and compare trends in metrics for multiple data series. An example use-case of this would
be to plot the metric performance for several sub-populations of the dataset. To plot multiple series against a single metric,
multiple Monitors with names corresponding to the series name can be scheduled with the same metric_name.
Consider the following three Monitors:
foundations monitor create --name evaluate_1 --project_name example-project . evaluate1.py

foundations monitor create --name evaluate_2 --project_name example-project . evaluate2.py

foundations monitor create --name evaluate_3 --project_name example-project . evaluate3.py
In this case, three Monitors are created to track metrics and each monitoring script would contain the same metric name. The differences between the evaluation scripts would be the set of predictions used for metric calculations.